
DATA VISUALIZATIONS
Bring your spreadsheets to life
Set your data free with our dynamic, online dashboards. Turn your numbers into vivid, interactive visuals that engage instantly, update in real time, sync to any device, and can be tailored to any individual—democratizing data access across your whole team, from the front lines of care to the C-suite.
Data that’s easy to understand
and act on

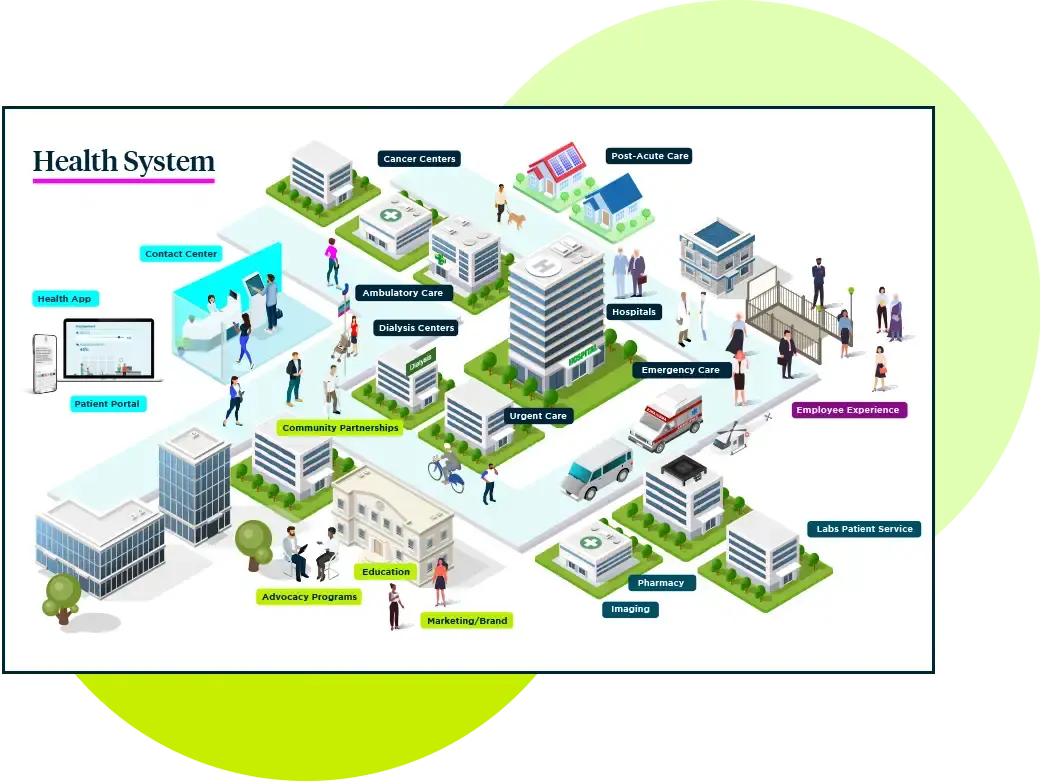
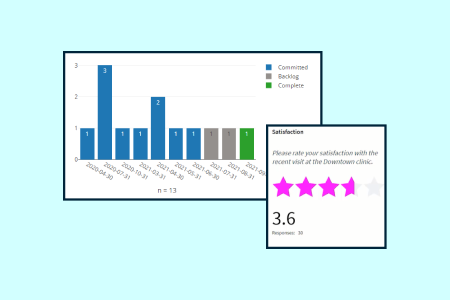
Bring black-and-white numbers into full color
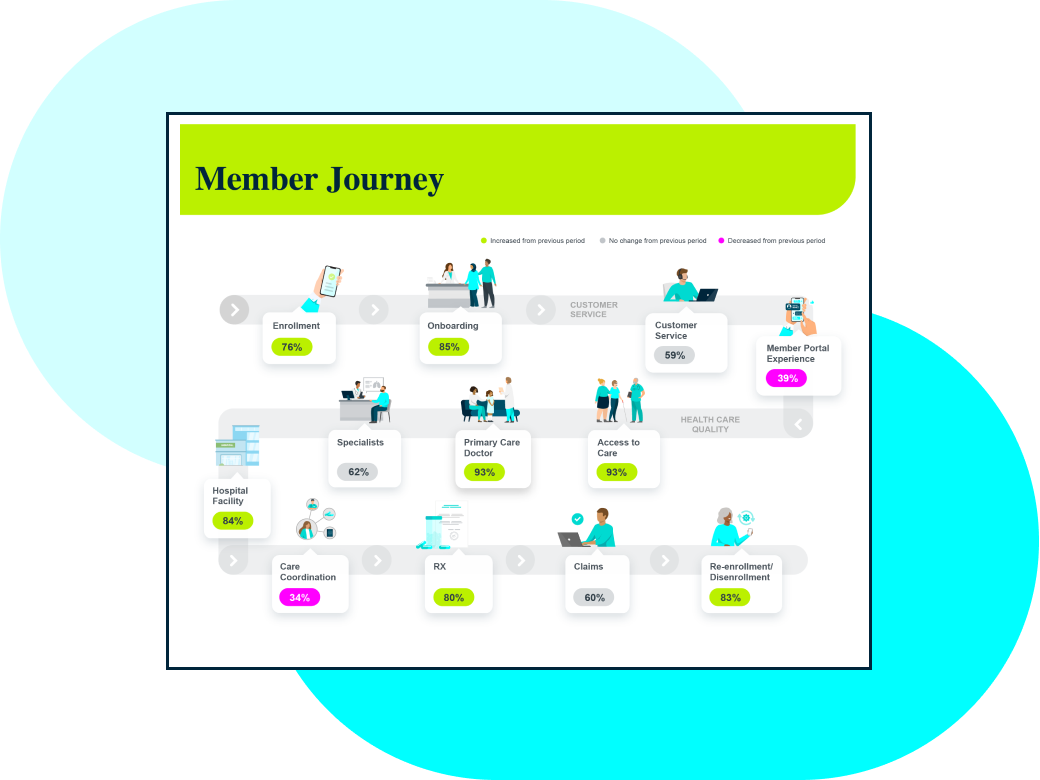
Craft easy-to-update infographics that show the steps of a patient’s journey, address pressing issues, or explain trends in a way that numbers never could.
Get creative with smart design tools
Use templates to make graphics on the go, or build your custom dashboard from scratch with drag-and-drop features. No programming needed.

All data leads back to you
Our APIs bring data insights to your infographics in real time. Watch your dashboard update as soon as things change, and get alerts whenever something unexpected is happening with your data.

Different people. Different dashboards.
You can tailor your dashboards to specific individuals or roles, and filter to make sure people only see what they need to.
All-in-one
Everything you need, in one intuitive platform
When so much is at stake, there’s no time to waste. Our software tools make every task quicker and slicker—whether you’re preparing a highly visual board presentation, comparing the KPIs for a system of regional facilities in one view, or using a virtual huddle board for daily rounding. Best of all, you can do all of these and more from one simple platform.
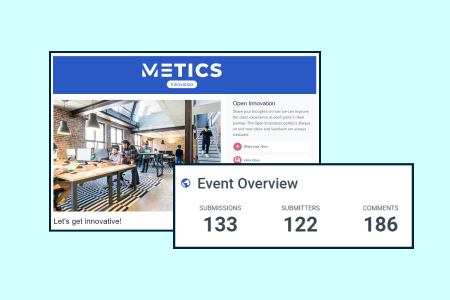
infographics
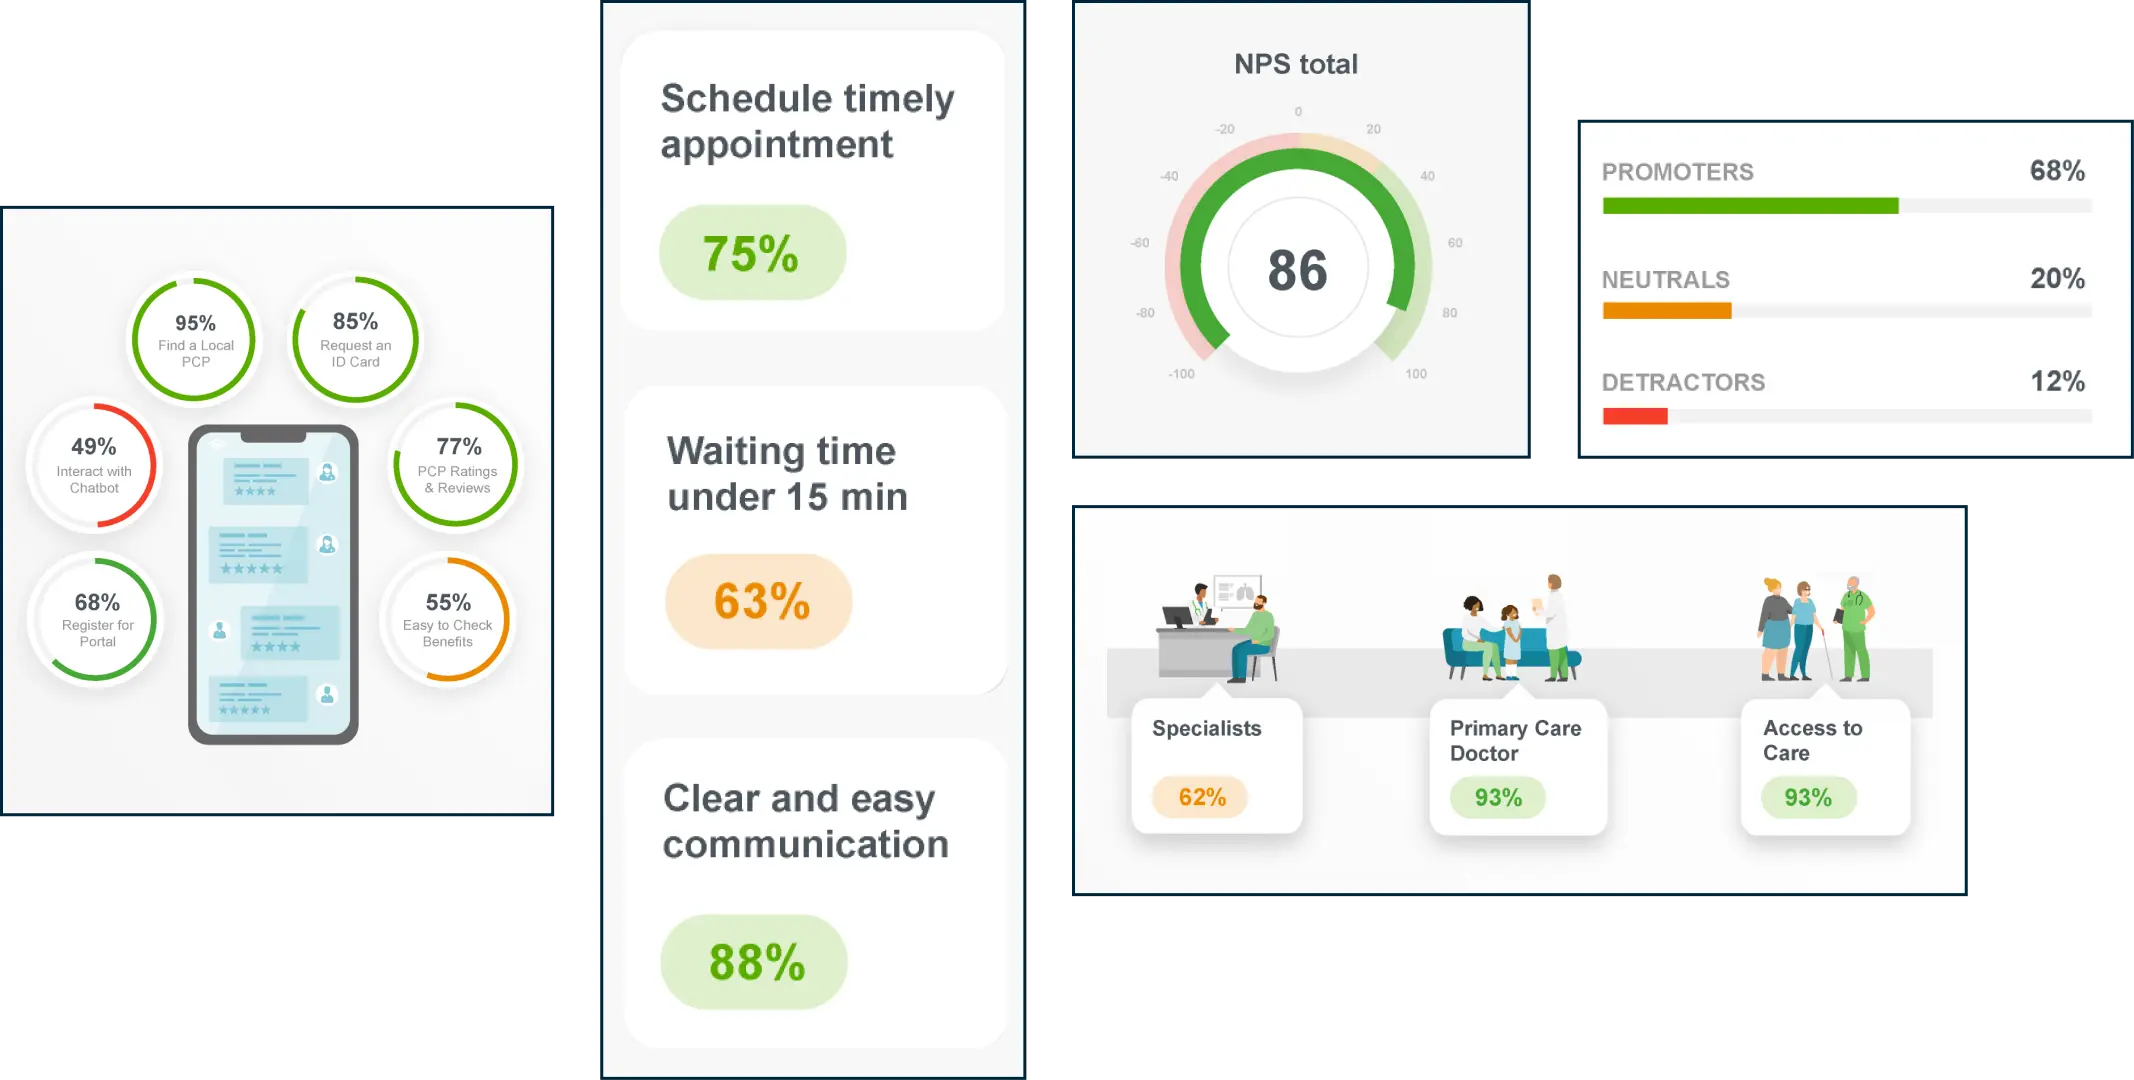
Stories you can see. Data you can touch.
Turn lists and numbers into living, breathing dashboards. We’ve reinvented reporting so it’s visual, interactive, and ready to go anytime, anywhere. Our template library and drag-and-drop tools let you customize the experience, and shape the data in ways that make sense to you.
Giving you the tools to make a difference
Your biggest challenges meet our best solutions
gather
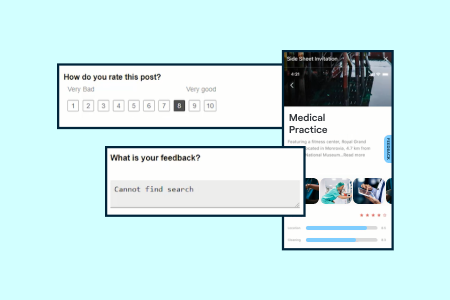
Digital feedback
gather
Crowdsourcing
gather
Effective reporting
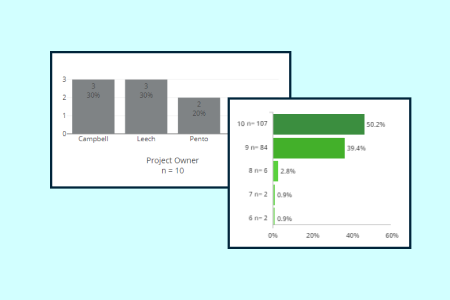
visualize
Interactive online dashboards
data visualizations
See your healthcare data differently
Get in touch, and we’ll show you just how powerful your data can be.